


Three popular projection websites tell a similar story about the Pirates. Fangraphs, which averages two models called ZiPS and Steamer, projects an 80-82 record and a last-place finish in the NL Central. PECOTA projections by Baseball Prospectus also give 80 wins and fourth place. Clay Davenport’s model predicts 79 wins and fifth place.
And, really, it’s not too much of a surprise to see this. The Pirates seem designed to be a .500 team.
Last year, the projections were similar. Fangraphs predicted 76 wins, Davenport 78, and Baseball Prospectus and FiveThirtyEight (which hasn’t been published yet this year) both said 77.
The Pirates were 82-79 last year, though they allowed more runs than they scored, finishing slightly better than the projections.

The projection systems don’t agree on all teams, though. The Cubs, for example, are predicted to win 87 games by Fangraphs but just 79 in PECOTA for a last-place finish. The Pirates seem especially, well, predictable.
A difference in the models doesn’t directly translate to a wide range of possibilities. According to Jared Cross, creator of Steamer Projections, most teams have a similar variance, which is quite large.
“If you played it out, with a half-chance of winning every game, you simulate it a lot of times, [the Pirates] would average 81 wins, but give or take like 6.5 wins,” said Cross. And that’s even if you knew every player’s skill. “Which means it’s not too shocking if they win 15 more games than we expect, or lose 15 more games than we expect.”
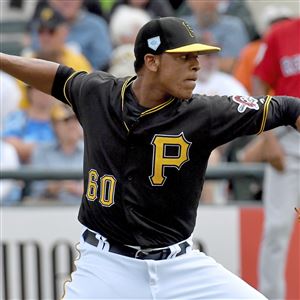
To see why the models think the Pirates are so average, let’s take Trevor Williams as an example.
Williams finished last year with a 3.11 ERA and a 14-10 record, both very good numbers. That was highlighted by a 7-3 second-half split with a 1.38 ERA, suggesting a potential breakout.
But Williams is projected to have much worse numbers this year.
The biggest projected difference is in home runs. Last year, Williams gave up 15 round-trippers, 0.79 every nine innings. That was a better rate than in 2017 (0.84), suggesting Williams did a better job keeping well-hit balls in the park. But, looking at pitch tracking numbers, Williams had a significantly increased fly-ball rate while also allowing harder-hit balls.

Williams allowed a home run on 8.0 percent of fly balls, well below the league average of 12.7 percent. Cross says that, historically, pitchers with a low HR/FB rate tend to revert back to average in that category. With a league-average HR/FB rate last year, his projected ERA (xFIP) was 4.54, a sharp decline. Danny Duffy and James Paxton were the only pitchers in 2017 with as low a rate. Both were much worse in 2018.
Williams is expected to have worse luck with home runs this year, and thus a worse season. Baseball-Reference is the most generous to him, projecting a 10-9 record, a 3.61 ERA, and 16 homers in slightly fewer innings.
ZiPS is somewhat harsher, giving Williams an 11-10 record but a 4.06 ERA with the same 16 home runs. Steamer projections are worst of all, predicting an 8-10 record and a 4.72 ERA, a huge drop from last season. With similar walk and strikeout rates, they give Williams 19 home runs allowed, 1.20 per nine innings.
(Some of these numbers may be slightly different by the time you read this. The projections are always changing with different inputs and shifting rosters.)
Essentially, the metrics say that Williams gave up fewer dingers than he should have, given how many hard hits and fly balls he allowed, and clustered hits in ways that led to fewer runs than expected. In fewer words, he got lucky. And that’s not expected to continue this year.
“We think, basically, he’s not nearly as good as he was last year,” Cross said. “Some of what made him successful are the kinds of things he’s not going to be able to repeat.”
Williams in more ways encapsulates the Pirates. He’s 26 years old, turning 27 in April, so he is likely near his peak. He’s also under team control, entering his third full season, and won’t hit free agency for three more years, meaning the Pirates pay him just $575,000 this year.
The Pirates have just eight players signed to guaranteed major league contracts. The rest of the roster will be made of spring training invites like Francisco Liriano, arbitration players like Corey Dickerson, or rookie contracts like Williams.
Plenty has been written already about Pirates payroll decisions. But without making huge upgrades in the offseason, it’s unlikely they improve.
Some players, like Williams, will get lucky or beat their projections. Others will fall short. The sum will fall somewhere in the middle.
Part of the similarity in projections comes from the models themselves, which are designed largely using the same ideas. The main idea is to use a player’s past to predict the future, and they do that in slightly different ways.
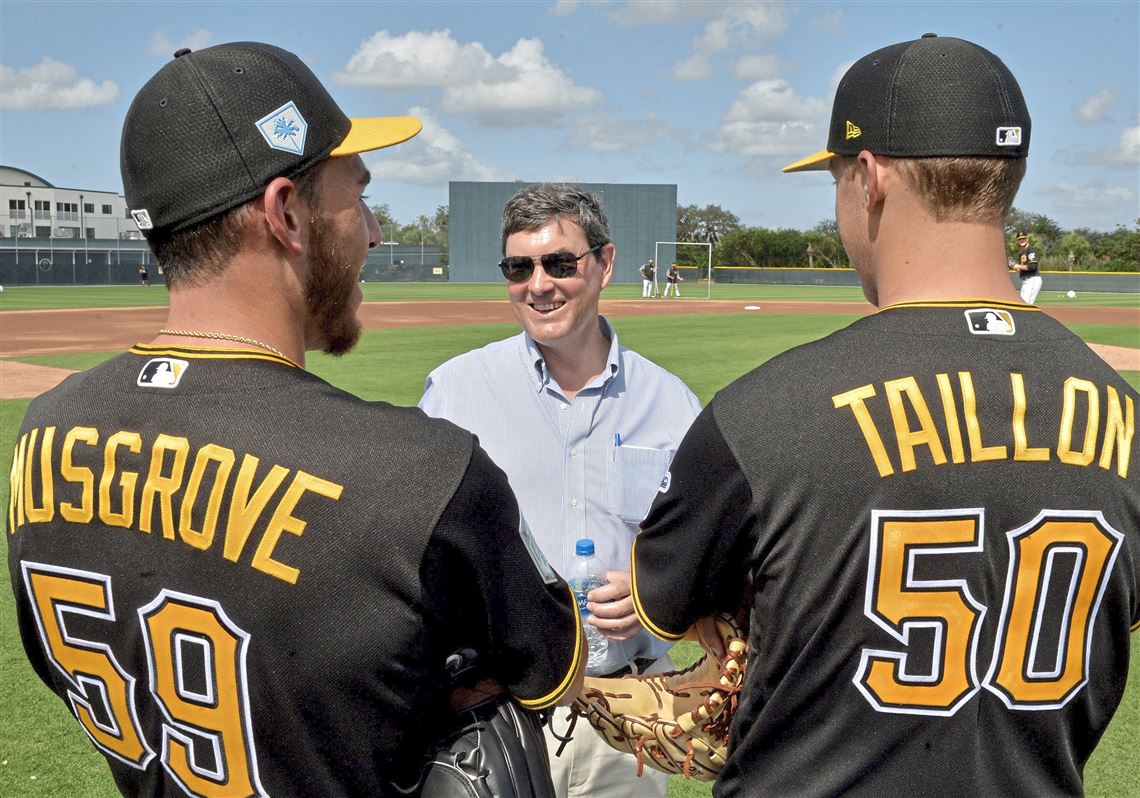
Let’s take Jameson Taillon as an example. Taillon will be 27 years old this season, his fourth in MLB. Last year, he was a very good pitcher, just below All-Star level, with a 3.20 ERA, worth 4.7 Wins Above Replacement.
Given his age, Taillon would be expected to have peaked last year, and decline slightly this year, but not by much. He also may have gotten slightly lucky last year, and the models adjust for that with their given metrics.
That’s the majority of a projection — using past statistics and age curves to predict the upcoming season. Baseball-Reference’s Marcel the Monkey system stops there, while ZiPS and Steamer add some more onto that, weighting past seasons differently and using various data points.
PECOTA, developed by Nate Silver, has a nuanced difference, and has been been adapted by FiveThirtyEight for basketball (CAREMLO) and congressional districts (CANTOR). Rather than grouping players by age, it looks at each player individually, and looks for similar players from the past.
For Taillon, it would “forecast his season based on his outcomes through 2018 and apply adjustments for his upcoming age-27 season based on the the career arcs of similar players,” per Rob Mains of Baseball Prospectus.
Taillon’s most comparable players are Jordan Zimmerman, Patrick Corbin and Jake Odorizzi. PECOTA takes a big list of similar players, averages how they aged the following season, and uses that to predict Taillon.
All told, the models are designed with similar ideas, and it shouldn’t be too surprising that they give similar answers. None of these models publishes a range of forecasts, and maybe they should. It’s baseball, of course, and surprises happen all the time.
But if you believe the numbers, don’t hold your breath for the Pirates. Pittsburgh will likely be near average this year. Maybe you don’t need a model to tell you that.
Ari Levin: alevin@post-gazette.com
First Published: February 25, 2019, 4:16 p.m.